

Part 2: Overview of Elastic Search Architecture
This is the part 2 of the Complete Elasticsearch tutorial. Let's get started


This is a second part of the Complete Elastic Search Tutorial Series. If you have missed out on the first part checkout it out here.
What is covered in the post
- Basic Architecture of Elasticsearch
- Inspecting the Cluster
- Taking a look at Kibana
Understanding the Basic Architecture
In the first part, we installed and started the elastic search, what we started is called a node.
What is a Node?
A node is an instance of elastic search which stores our data.
We can run as many nodes as want according to our data need and each node will contain a part of our data. Remember node is an instance and it doesn't refer to a machine so you can run any number of nodes on your dev machine.
All the related nodes are grouped together in a cluster. We will look at clusters in detail in the coming part.
Nodes contain documents that are basically
JSONobjects. But elastic search stores some metadata with the JSON object.
// This is the data user inputs to Elastic search
{
    "name" : "Rushil Patel",
    "country" : "India"
}
// This is the object Elastic search stores with some metadata
{
    "_index" : "people",
    "_type" : "_doc",
    "_id" : "123",
    "_version" : 1,
    "_seq_no" : 0,
    "_primary_term" : 1,
    "_source": {
        "name" : "Rushil Patel",
        "country" : "India"
    }
}
As you can see there is a _index field Elasticsearch added for us in the document.
An index is a group of documents that have similar characteristics and are logically related. For example people, cars, etc.
An index theoretically may contain infinite documents.
Later in the series, you will see that when we perform the query to search a document we make use of these indices.
Now let's fire up our consoles or Kibana tool to look at how a cluster looks. I will be using kibana for this demo. If you want to follow and want to install kibana checkout the part 1 of the series for installation.
Inspecting the Cluster
After starting kibana, navigate to the Dev Tools page and you will a similar dashboard.
Now enter GET _cluster/health on the left-hand side and press the run button next to it. You should get a similar output.
{
  "cluster_name" : "elasticsearch",
  "status" : "yellow",
  "timed_out" : false,
  "number_of_nodes" : 1,
  "number_of_data_nodes" : 1,
  "active_primary_shards" : 11,
  "active_shards" : 11,
  "relocating_shards" : 0,
  "initializing_shards" : 0,
  "unassigned_shards" : 4,
  "delayed_unassigned_shards" : 0,
  "number_of_pending_tasks" : 0,
  "number_of_in_flight_fetch" : 0,
  "task_max_waiting_in_queue_millis" : 0,
  "active_shards_percent_as_number" : 73.33333333333333
}
So let's understand what going on.
The elastic search uses REST API under the hood to perform query calls.
So you could use any of the HTTP request types for your query.
In the above example, we have sent a GET query to elastic search to get the data.
In the example, you could see _cluster. It is an API we want to access. And APIs in the elasticsearch by convention start with _.
health is a command we want to perform on that API.
So basically the above query will get the health report from our cluster which you could see on the right-hand side in your Kibana tool or in your terminal.
Previously we talked that running when we start elasticsearch we start a node. Elasticsearch has a built-in command to access nodes, let's take a look.
-> Run GET /_cat/nodes?v. It will return something similar shown below.

Similarly, we could run commands for indices.
Run GET /_cat/indices?v and you can see the output similar to the given image
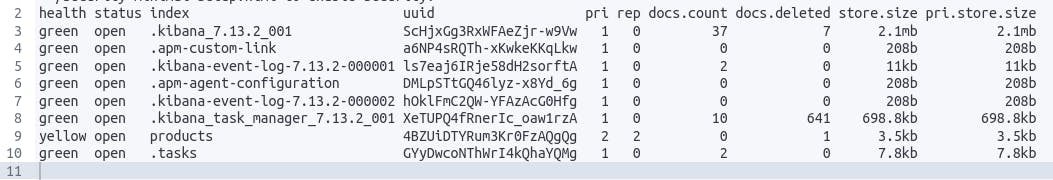
You might not have the exact same result but as you can see there are few indices kibana makes for us out of the box.
As you can see that kibana provides a great GUI for us to write queries in elasticsearch. It also provides autocomplete feature which will help us to be productive and we will not have to remember the syntax. We will be using it throughout the series.
Summary
We have seen the basic architecture of the elastic search and how it works. We also inspect clusters using kibana and looked at how kibana helps in writing queries.
Part 3 coming soon, in the next part we will be looking at Sharding & scalability. And we will also understand how replication works in elastic search.